Run-off volatility

When investigating risk in an annuity portfolio, a key task is to simulate the future lifetime for each annuitant.  Survival models make this particularly easy, as covered in an earlier posting on simulating lifetimes.

One of the first things which strikes practitioners is that volatility in run-off valuations increases with the average age of a portfolio.  The reason for this is that the variation in future lifetime gets larger relative to the average future lifetime.  One way of looking at this is to use the coefficient of variation, which is simply the standard error of the future lifetime divided by the mean:

coefficient of variation = standard error / mean

The coefficient of variation is normalised in that it expresses variability relative to the mean.  It is therefore sometimes expressed as a percentage to show relative volatility.  This is illustrated in Figure 1, which shows the distribution of age at death by duration since outset for three key ages.

Figure 1. Distribution of age at death by time since outset.  Mortality according to S1PA males.
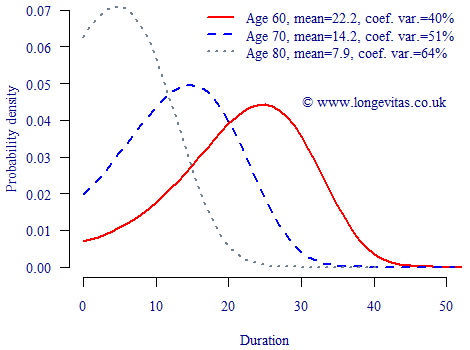
Distribution of age at death by duration from outset age

Figure 1 shows that the actual variation in future lifetime is largest for younger ages, as indicated by the wider spread. However, when this variation is expressed relative to the expected future lifetimes, we see that the relative volatility is actually larger at older ages. A corollary of this is that pensions or annuities with spouses' benefits will lower the relative volatility in run-off, in part because spouses' benefits increase the average duration of payments.


Run-off simulations in Longevitas

Longevitas does full portfolio run-off simulations on a life-by-life basis. The output enables the measurement of trend risk, idiosyncratic risk and concentration risk, and you can examine the variation in time lived, cash paid and the value of cashflows paid.  The risks associated with model-point selection are side-stepped by simulating every single life.

Longevitas can also perturb a nominated parameter between each portfolio simulation.  This is done with respect to the estimated standard error for the parameter concerned, with the rest of the model being fitted around the perturbed value.  This "perturbation run-off" allows the measurement of the impact of parameter risk on time lived, cash paid and the value of cashflows.
 

Previous posts

Personal standards

Love them or loathe them, actuaries cannot get by without standard tables in some shape or form. Even when performing analysis of your own experience data to avoid basis risk, standard tables are often used as a kind of lingua franca between parties, a convenient way to express approximate results in a way everyone can understand.
Tags: Filter information matrix by tag: technology, Filter information matrix by tag: standard table

East meets West

This month sees the twentieth anniversary of the fall of the Berlin Wall.  This is therefore an appropriate time to remind ourselves of a dramatic example of the plasticity of mortality. 
Tags: Filter information matrix by tag: mortality plasticity, Filter information matrix by tag: Germany

Add new comment

Restricted HTML

  • Allowed HTML tags: <a href hreflang> <em> <strong> <cite> <blockquote cite> <code> <ul type> <ol start type> <li> <dl> <dt> <dd> <h2 id> <h3 id> <h4 id> <h5 id> <h6 id>
  • Lines and paragraphs break automatically.
  • Web page addresses and email addresses turn into links automatically.