Winter mortality

In previous posts we looked at seasonal fluctuations in mortality.  Since the UK is about to experience some particularly cold weather again, we will look at winter mortality in more detail.

The Office for National Statistics in England and Wales produces statistics comparing the mortality of three winter months with three summer ones.  These statistics take the form of excess numbers of deaths in winter, as shown in the graph below:
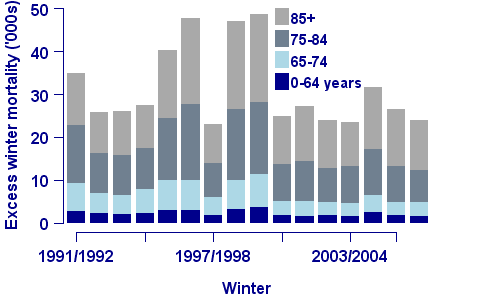
Excess winter mortality

As can be seen in the above graph, it is the elderly who bear the brunt of excess winter mortality.  There are a number of reasons for this, of which one of the best known is influenza, which is particularly infectious during winter months.  Influenza can kill directly, but it often sets a chain of events in motion which lead to death due to other causes such as heart attacks.  It is believed that for every death directly attributed to influenza, there are several more where influenza played a hidden role.


Written by: Stephen Richards
Publication Date:
Last Updated:

Seasonal patterns in Longevitas

Longevitas supports two methods of modelling seasonal patterns:

  1. The CalendarPeriod variable, and
  2. The SeasonalEffect variable.

Longevitas users can fit models with a variety of period effects using the CalendarPeriod variable. Simply go to the Configuration section and enable this in the Modelling tab. There you will also have the option to select the frequency of effects, as well as their alignment during the year. The CalendarPeriod is a categorical variable, i.e. the effect is assumed to be constant within the period.

The SeasonalEffect variable is a feature of the Hermite family of models. It is a continuous variable, and so is a more parsimonious option when modelling post-retirement mortality differentials.

Previous posts

Concentrate!

One of the challenges in modelling financial portfolios is the concentration of risk arising from the fact wealthier people will usually have significantly higher benefits than the less well-off.
Tags: Filter information matrix by tag: concentration risk, Filter information matrix by tag: visualisation, Filter information matrix by tag: mapping

Logistical nightmares

A common Generalised Linear Model (GLM) for mortality modelling is logistic regression, also sometimes described as a Bernoulli GLM with a logistic link function.  This models mortality at the level of the individual, and models the rate of mortality over a single year. 
Tags: Filter information matrix by tag: GLM, Filter information matrix by tag: logistic regression

Add new comment

Restricted HTML

  • Allowed HTML tags: <a href hreflang> <em> <strong> <cite> <blockquote cite> <code> <ul type> <ol start type> <li> <dl> <dt> <dd> <h2 id> <h3 id> <h4 id> <h5 id> <h6 id>
  • Lines and paragraphs break automatically.
  • Web page addresses and email addresses turn into links automatically.