Mortality shocks
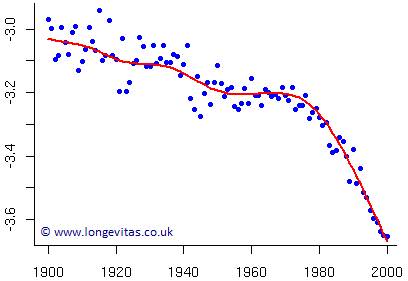
Mortality, and in particular rapidly improving mortality, has shot up the actuarial agenda in recent years. Actuaries have been caught by surprise not so much by the improvement (which has been happening steadily for over a hundred years now) but by the acceleration in the improvement. This accelerated improvement started around 1970 and shows no sign of running out of steam. The graph of mortality heads steadily south, albeit at an increasing speed. The graph below illustrates the dramatic turn of events that took place around 1970 for Swedish males at age 70 (data from the Human Mortality Database):
Figure 1. Log mortality for Swedish males aged 70

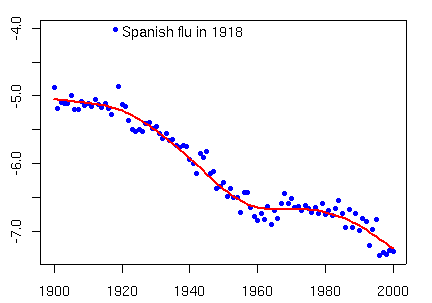
However, other more spectacular changes in mortality are possible. In 1918-19 Spanish flu killed more people than died in the whole of the First World War; estimates are necessarily imprecise but somewhere between twenty and fifty million seems likely. The mortality surface was subjected to a dramatic but temporary jolt before it returned to its former more sedate self. Jolts, or shocks as we prefer to call them, on the scale of Spanish flu are rare indeed but smaller shocks can occur; for example, very cold winters or heatwaves can each cause an increase in the number of deaths. Unlike the Spanish flu which affected mainly young healthy adults, extreme weather affects mainly the old and vulnerable. Modelling the steady progress of the mortality surface while allowing for random shocks in time presents a particular challenge for the modeller. Even without shocks, the mortality surface is complex with the improvement in time at different ages following different patterns; for example, the AIDS epidemic mainly affected young adult males.
Figure 2. Log mortality for Swedish males aged 30

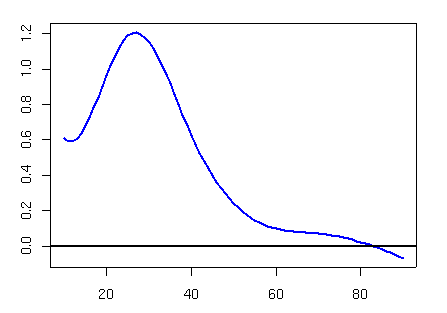
A comparison of Figures 1 and 2 demonstrates the very differently shaped paths traced for those age 30 and those age 70. Thus, the fitted surface must consist of two components: a flexible smooth surface and random shocks (possibly age dependent) to individual years. James Kirkby and I have presented a model which captures both the smooth surface and the random shocks. Figure 3 shows the massive shock to the mortality surface in 1918 caused by the Spanish flu pandemic:
Figure 3. Log excess mortality by age for Swedish males during 1918 Spanish influenza pandemic

The sinister shark’s fin estimates the excess mortality over an expected smooth baseline mortality. The estimated excess is chilling indeed, with death rates increasing by a factor of three approximately for males around thirty years old. The extreme outlier in Figure 2 shows the effect of Spanish flu on the mortality of a thirty year old male in 1918. How can we predict such annual shocks when by their very nature they occur at random? Of course, the short answer is – we can’t. The long answer is that such shocks add to the risk inherent in estimating future mortality. Our fitted model allows us to create a collection of shocks, of which the shark’s fin in Figure 3 is the most striking example. We now simulate future mortality in some fashion. Shocks occur at random in the past so we assume that they will occur at random in the future. So instead of proceeding directly to our actuarial example, we add to our estimated mortality for each year a randomly chosen shock, taken from our collection; only now do we proceed to our actuarial application. The general conclusion to be drawn from this discussion is rather unpalatable. Shocks can only add to the mortality risk of an insurance product; additional reserves will be required. On the bright side, the above model can help to determine the appropriate size of such a reserve.


Add new comment