Smoothing
The late Iain Currie was a long-time advocate of smoothing certain parameters in mortality models. In an earlier blog he showed how smoothing parameters in the Lee-Carter model could improve the quality of the forecast. As Iain himself wrote, "this idea is not new" and traced its origins to Delwarde, Denuit & Eilers (2007).
The Lee-Carter model is not the only mortality-projection model that can be enhanced with smoothing. Another example is M9, proposed by Cairns et al. (2015):
\[\log \mu_{x,y} = \alpha_x + \kappa_{0, y} + \kappa_{1, y}(x-\bar x) + \kappa_{2, y}\left((x-\bar x)^2-\hat\sigma^2\right)+\gamma_{y-x}\qquad (1)\]
where \(\alpha_x\), \(\kappa_{0, y}\), \(\kappa_{2, y}\), \(\kappa_{2, y}\) and , \(\gamma_{y-x}\) are parameters to be estimated, typically with any necessary identifiability constraints. However, as with the Lee-Carter model, parameters in age show a high degree of regularity, as shown by the open circles in Figure 1. Indeed, the progression by age is so regular that there is no meaningful difference in fit if we replace the 56 individual \(\alpha_x\) parameters with a curve formed from a basis of \(B\)-splines, as shown by the solid grey line in Figure 1.
Figure 1. \(\hat\alpha_x\) using smoothed and unsmoothed structure in M9 model. Source: own calculations using ONS data for females in England & Wales, 1971-2019, ages 50-105.
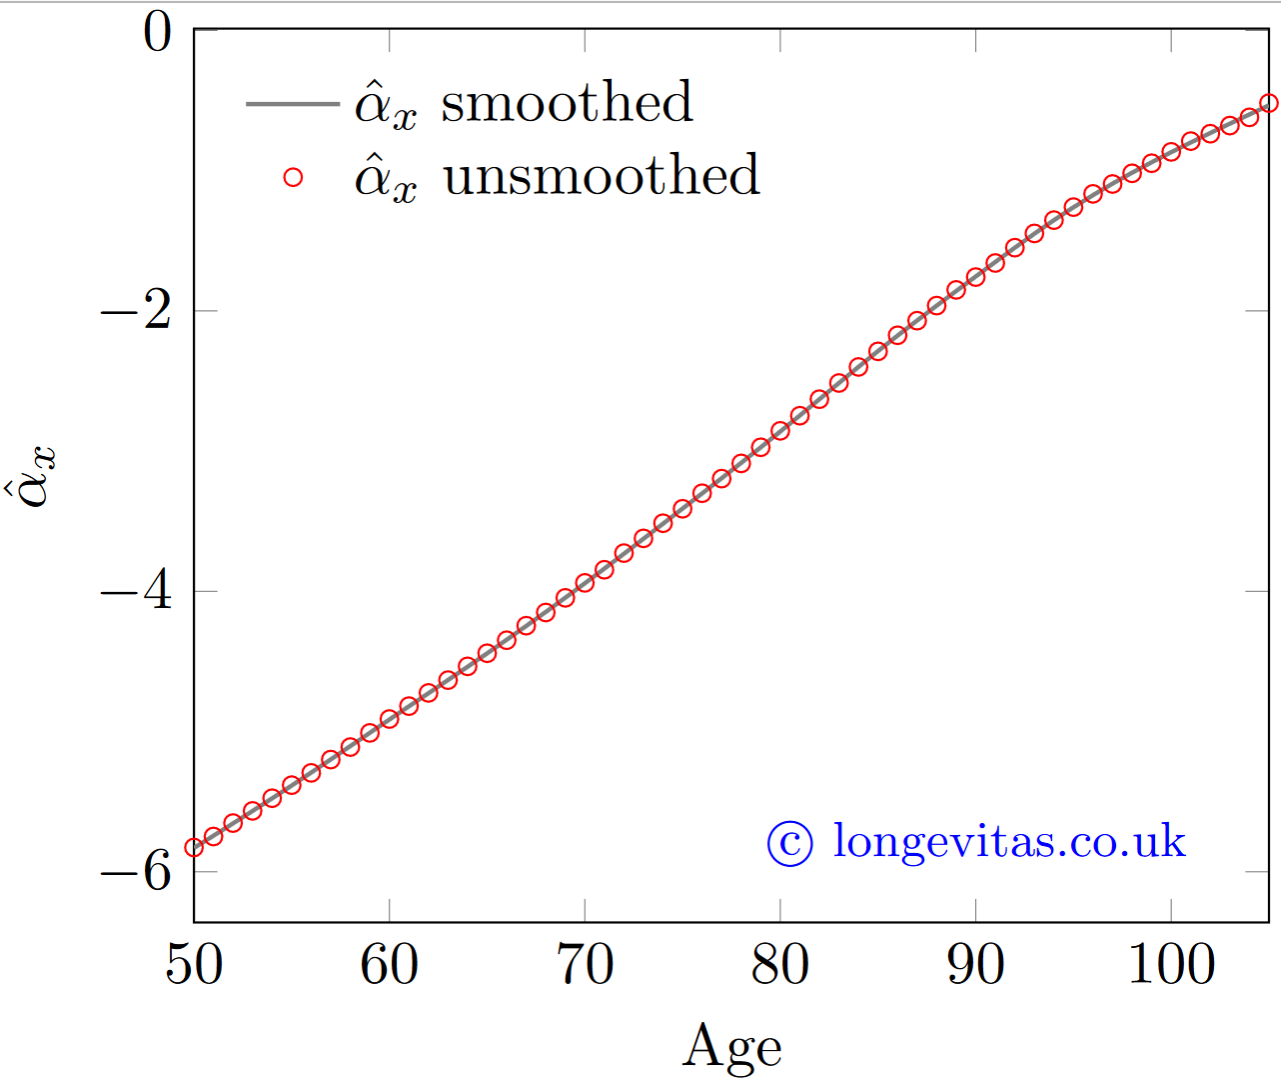
Figure 1 shows that there is no meaningful difference between the smoothed and unsmoothed \(\hat\alpha_x\) values. There is therefore no loss of fit. However, there is a substantial improvement in the BIC, as shown in Table 1.
Table 1. BICs for smoothed and unsmoothed versions of M9. Source: own calculations using ONS data for males and females in England & Wales, 1971-2019, ages 50-105.
| Model | Males | Females |
|---|---|---|
| M9 | 7194.1 | 7372.0 |
| M9(S) | 7072.2 | 7185.3 |
| Improvement | 121.9 | 186.6 |
If the parameter estimates are little changed (see Figure 1), then why have the BICs improved so much in Table 1? The answer is that the model fit as measured by the log-likelihood is almost the same, but the effective number of parameters has been reduced by smoothing. This also goes by the name of effective dimension of a model. Table 2 shows the effective dimensions of the models in Table 1.
Table 2. Effective dimensions for smoothed and unsmoothed versions of M9. Source: own calculations using ONS data for males and females in England & Wales, 1971-2019, ages 50-105.
| Model | Males | Females |
|---|---|---|
| M9 | 281 | 281 |
| M9(S) | 237.3 | 236.4 |
| Reduction | 43.7 | 44.6 |
For unsmoothed models, the effective dimension is the same as the number of parameters. This is why the M9 values in Table 2 are integers, and why there is the same value for males and females.
For smoothed models, however, the effective dimension is a real number. Furthermore, the effective dimension decreases with heavier smoothing. This is why the M9(S) values in Table 2 are not integers, and why there is not the same value for males and females - heavier smoothing has been applied to the female pattern of \(\alpha_x\), thus reducing the effective number of parameters by a further 0.9.
If the benefit of smoothing in the Lee-Carter model is improved forecast quality, what is the benefit of smoothing M9? Tables 1 & 2 show that the smoothed model is more parsimonious, as we would expect. However, another benefit of smoothing with age is that it permits the extrapolation of age effects beyond the limit of the data. If you estimate an \(\hat\alpha_x\) parameter for each age, your forecast mortality rates cannot exceed the upper age in your data. However, if you estimate a smooth underlying curve for \(\alpha_x\), you can extrapolate and forecast sensible mortality rates above the maximum age in your data.
References:
Cairns, A. J. G., Blake, D., Dowd, K. and Kessler, A. (2015) Phantoms Never Die: Living with Unreliable Mortality Data, Journal of the Royal Statistical Society, Series A, 2015, doi:10.1111/rssa.12159
Delwarde, A., Denuit, M. and Eilers, P. H. C. (2007) Smoothing the Lee-Carter and Poisson log-bilinear models for mortality forecasting: a penalized likelihood approach, Statistical Modelling, 7, pages 29-48, doi:10.1177/2F1471082X0600700103
The smoothed version of M9 is available in the Projections Toolkit from v2.8.7.
Add new comment