Seriatim data
In Macdonald & Richards (2024), Angus and I continue our long-standing advocacy for using individual records for mortality analysis, rather than grouped counts of lives. One argument in our paper is that the individual life is the most irreducible unit of observation in mortality analysis. After all, any group can be disaggregated into individuals, but further subdivision would just be dismemberment.
Among North American actuaries, individual records are typically referred to as 'seriatim data'. The advantages of working with seriatim data were recognised by Batten (1978):
the calculation of exposures by the seriatim method involves the consideration of each exposed life, one by one. The ages at which exposure contribution begins and ceases are determined for each life independently [...] the extreme simplicity of the seriatim method and the absence of approximating techniques makes it quite attractive, especially with the ever-increasing capacity of data processing machines
Batten, (1978, p62-63)
Batten was correct, and those powerful data-processing machines he referred now sit on our desks.
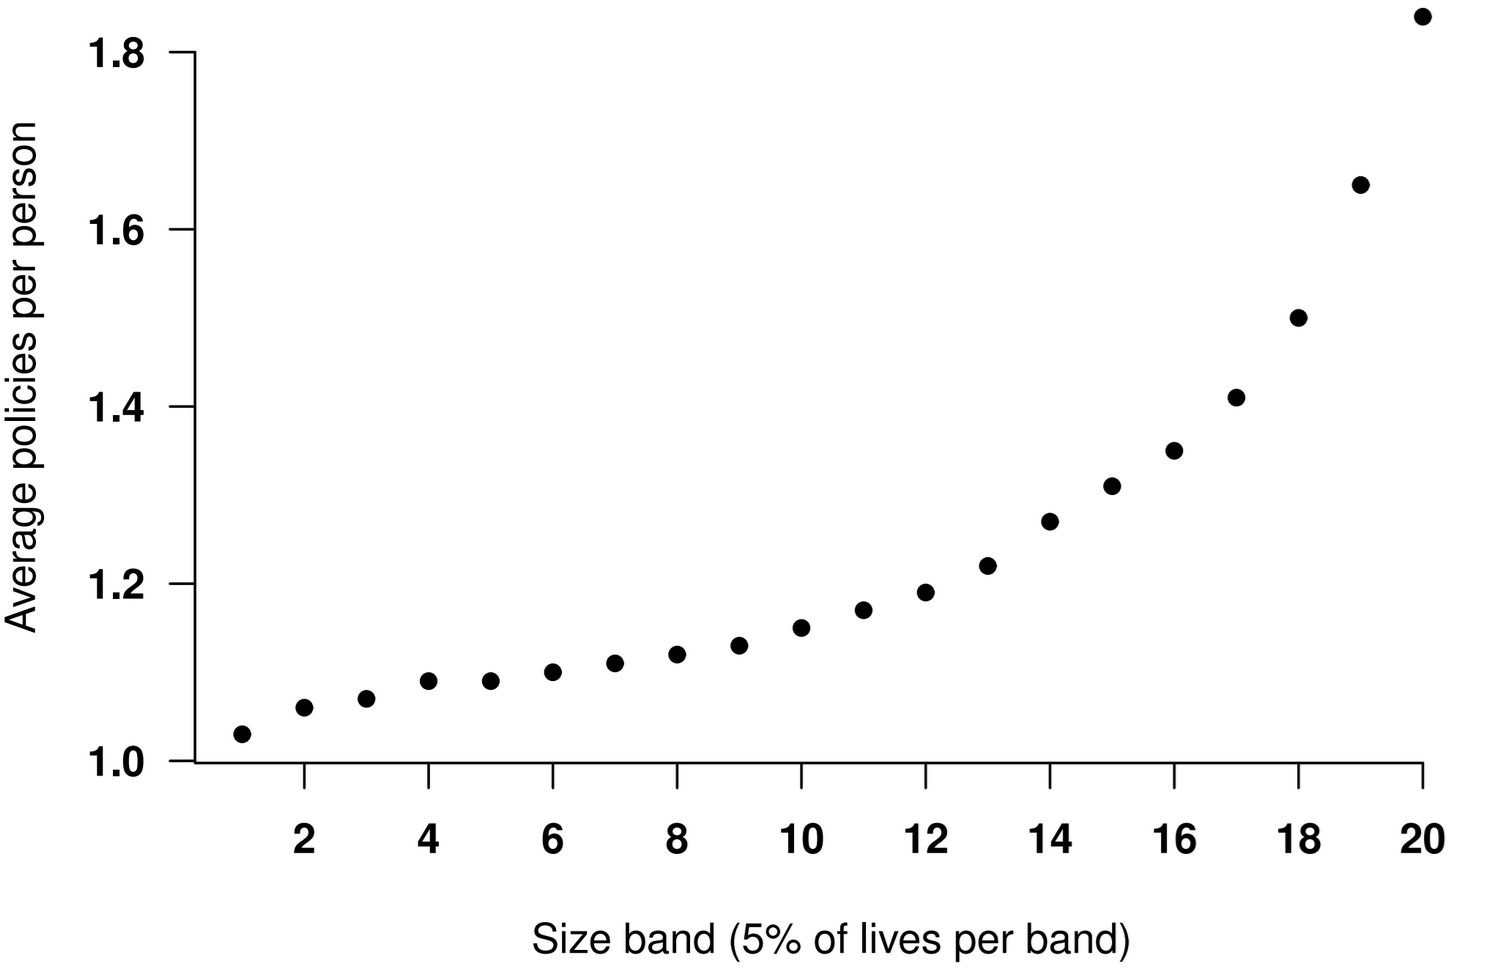
However, the fundamental unit in a typical administration system is not the individual but a contracted benefit or policy. It is common for individuals to have more than one policy, and often the number of policies is strongly correlated with wealth and income. This is shown in Figure 1.
Figure 1. Average number of policies per individual in a UK annuity portfolio. One individual has 31 annuities. Source: Macdonald et al (2018, Figure 2.3).

Seriatim data is ideal for calculating exposure for mortality analysis. However, this is complicated in actuarial data sets by the need to deduplicate, i.e. the identification of individuals and the aggregation of their policy records into a single observation of a lifetime. There are numerous ways to identify individuals with multiple policies - Richards (2009, pages 4-6) and Macdonald et al (2018, pages 27-29) give overviews of practical options.
References:
Batten, R. W. (1978) Mortality table construction, Prentice-Hall Inc, Englewood Cliffs, New Jersey.
Macdonald, A. S., Richards, S. J. and Currie, I. D. (2018) Modelling mortality with actuarial applications, Cambridge University Press, ISBN 978-1-107-04541-5, doi 10.1017/9781107051386.
Richards S. J. (2008) Applying Survival Models to Pensioner Mortality Data. British Actuarial Journal, 14(2), pages 257-303, doi10.1017/S1357321700001720.
Seriatim data in Longevitas
Longevitas works with seriatim data (individual records) and provides ten options for deduplication.


Add new comment