The product integral in practice
In a (much) earlier blog, Angus introduced the product-integral representation of the survival function:
\[{}_tp_x = \prod_0^t(1-\mu_{x+s}ds),\qquad(1)\]
where \({}_tp_x\) is the survival probability from age \(x\) to age \(x+t\) and \(\mu_{x+s}\) is the mortality hazard at age \(x+s\). Regular readers of this blog (both of you) will notice a striking similarity with the Kaplan-Meier estimate of the survival function:
\[{}_t\hat p_x = \prod_{t_i\le t} \left(1-\frac{d_{x+t_i}}{l_{x+t^-_i}}\right),\qquad (2)\]
where \(\{x+t_i\}\) is the set of unique ages at death, \(d_{x+t_i}\) is the number of deaths at age \(x+t_i\) and \(l_{x+t^-_i}\) is the number of lives alive immediately before age \(x+t_i\). The Kaplan-Meier estimate in equation (2) is the discretised equivalent of equation (1), meaning that \(d_{x+t_i}/l_{x+t^-_i}\) is an estimate of \(\mu_{x+t_i}(t_{i+1}-t_i)\). Many actuarial portfolios quickly reach a size where there are events every single day of the year, making \((t_{i+1}-t_i)\) as small as \(\frac{1}{365}\). This results in fairly smooth-looking Kaplan-Meier estimates, such as in Figure 1 below:
Figure 1. Kaplan-Meier estimates of survival function from age 60 for a medium-sized Canadian pension plan, 2013-2019.
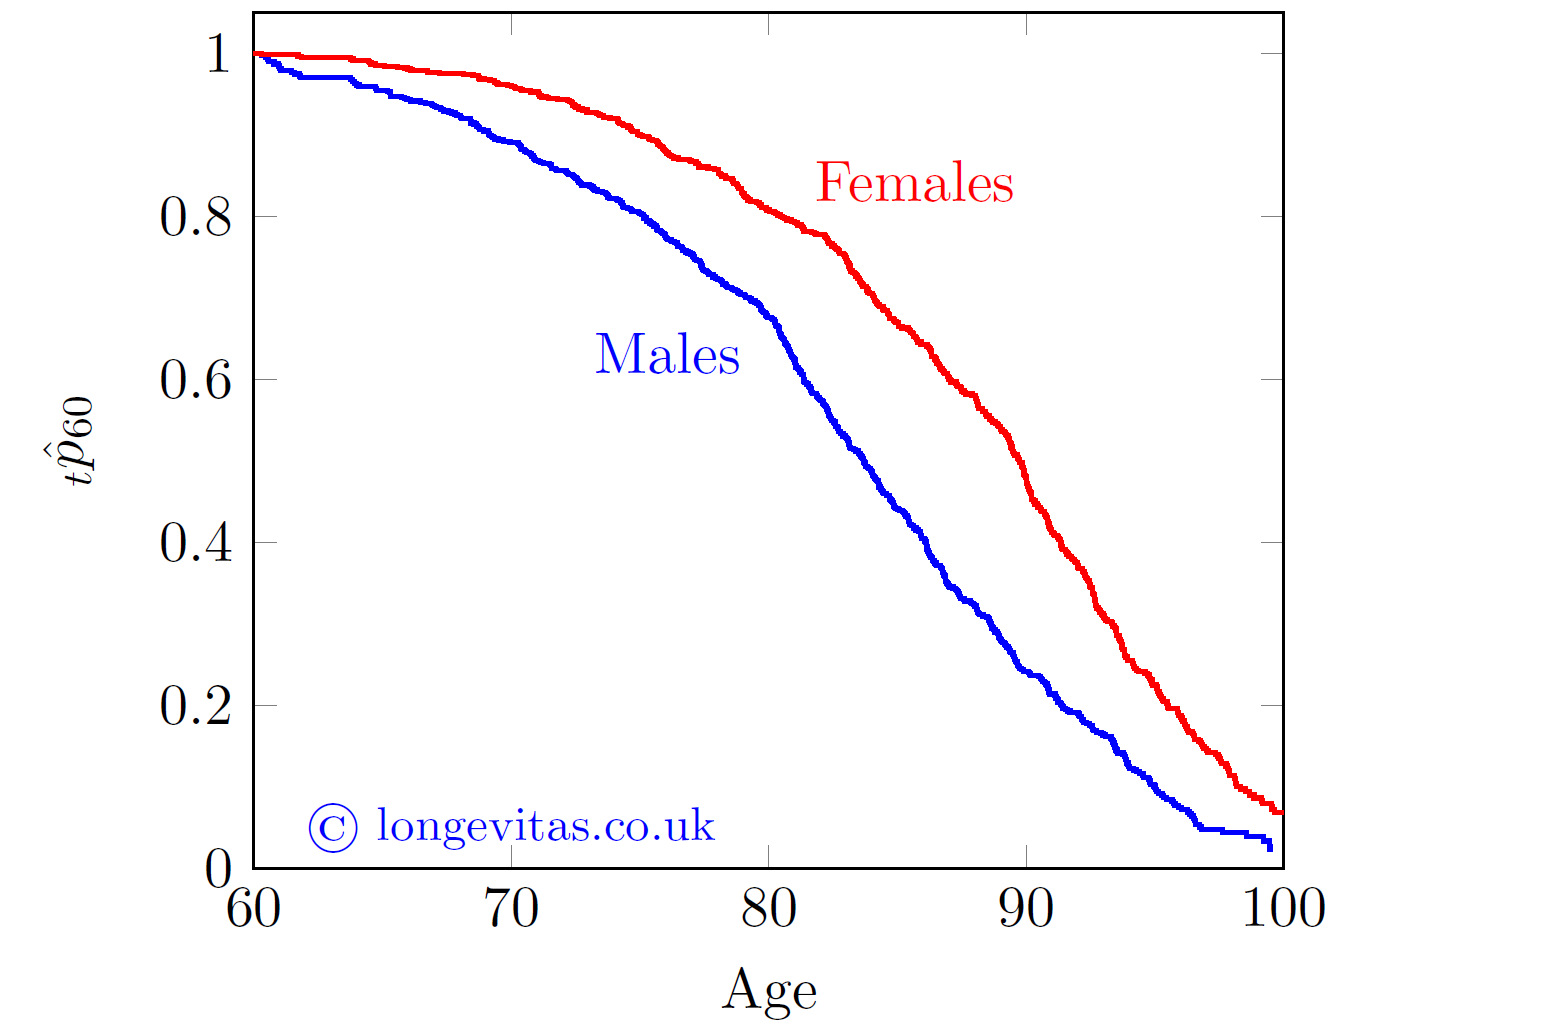
Behind Figure 1 lie 542 deaths among 3,871 females and 633 deaths among 3,141 males. Despite the relatively modest amount of data, the Kaplan-Meier estimate is surprisingly smooth.
The Kaplan-Meier estimate is one of the first things I calculate in any mortality analysis - not only is it an excellent visual communication tool for non-specialists, it is also very useful for diagnosing data-quality problems before fitting any models. Further examples of this are given in Richards and Macdonald (2024).
References:
Kaplan, E. L. and Meier, P. (1958) Nonparametric estimation from incomplete observations, Journal of the American Statistical Association, 53 (282), pages 457-481, doi:10.2307/2281868.
Richards, S. J. and Macdonald, A. S. (2024) On contemporary mortality models for actuarial use I - practice, British Actuarial Journal (to appear).
Kaplan-Meier estimation in Longevitas
Longevitas users can choose to generate Kaplan-Meier estimates for each risk-factor combination in a model, not just males v. females. The Kaplan-Meier estimates can be plotted in the Curves tab, or the underlying data for the plot can be downloaded as a CSV file or Excel spreadsheet.
Add new comment