Piquing interest in improvements
When underwriting a pension scheme for a bulk annuity or longevity swap, the first concern is understanding what mortality levels are, especially differentials amongst sub-groups. The next concern is whether the recent mortality improvements in the pension scheme are in line with the pricing basis; if the scheme has experienced faster improvements, say, then this would be a valuable insight for pricing.
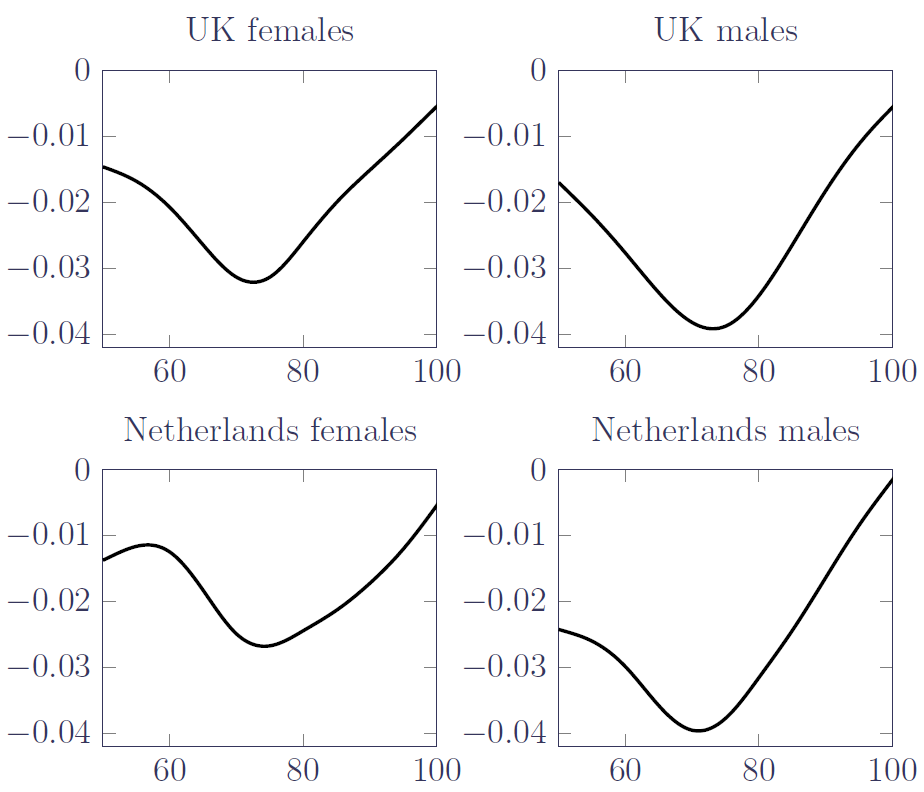
How do we check this when improvement bases are usually calibrated with population data, where the number of lives at a single age typically exceeds the number of lives in the entire pension scheme? How can you reliably detect improvement rates in a portfolio's own experience data? We can do this to a simple extent with survival models, but new techniques now enable greater insight. We start by considering the relevant patterns of improvement in the wider population, as in Figure 1:

The patterns in Figure 1 could be described as follows:
- An initial rate of change, \(\phi\), at the lowest age, \(x_2\) (\(x_2=50\) in Figure 1).
- A peak rate of change, \(\kappa\), achieved at age \(s_1\) (\(s_1\in [70, 80]\) in Figure 1).
- No change above age \(x_3\) (\(x_3\in (100, 105)\) in Figure 1).
We can model this by extending our age-varying mortality rate, \(\mu_x\), as follows:
\[\log\mu_{x,y} = \log\mu_x+\begin{cases}x\leq x_2 &: y\phi\\x\in(x_2, s_1)&: y[\phi h_{00}(v_1)+\kappa h_{01}(v_2)]\\x\in[s_1,x_3) &: y\kappa h_{00}(v_2)\\x \geq x_3 &: 0\end{cases}\qquad (1)\]
where \(v_1=(x-x_2)/(s_1-x_2)\), \(v_2=(x-x_2)/(x_3-s_1)\) and \(h_{00}\) and \(h_{01}\) are the Hermite-spline functions depicted in a previous blog. An interactive online tool for exploring Equation (1) can be found here.
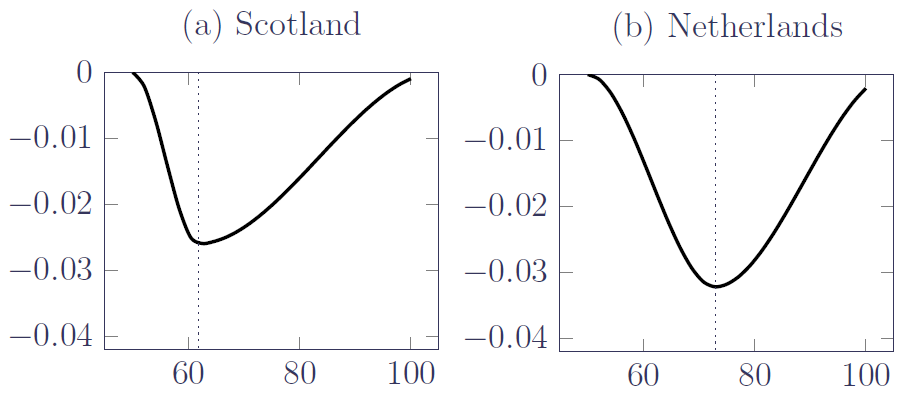
\(\phi\), \(\kappa\) and \(s_1\) are then parameters that can be estimated from the portfolio's own experience data. The results of doing so are shown in Figure 2 for two pension schemes, one Scottish and one Dutch, where we simplify the task by assuming \(\phi=0\) so that we just have to estimate two parameters:

Figure 2(a) shows that the peak rate of mortality improvement in the Scottish pension scheme has actually been lower than the improvements for either gender in the UK population, and that the peak is at a younger age. The improvement rates in the Scottish pension scheme are clearly different from those in the wider UK population. In contrast Figure 2(b) shows that the peak improvement in the Dutch pension scheme lies between the peak male & female improvements in the wider Netherlands population, and that the peak age in the portfolio is comparable to the peak age in the population. Thus, the improvement rates in the Dutch pension scheme are similar to those in the wider Netherlands population.
Such insights are of considerable use for bulk annuities and longevity swaps, as the (re)insurer gets just the one opportunity to underwrite the risk at outset. It almost goes without saying that the time to find out about faster improvements in a particular portfolio is before the deal is transacted!
References:
Richards, S. J. (2019) A Hermite-spline model of post-retirement mortality, Scandinavian Actuarial Journal, doi: 10.1080/03461238.2019.1642239.
Previous posts
Seasoned analysis
The importance of seasonal analysis was underscored by a recent letter form the UK insurance regulator. In a previous blog, I looked at quarterly seasonal variation in a portfolio of defined-benefit pensions, and in a more recent blog I looked at monthly seasonal variation in mortality in England & Wales.


Add new comment