Out of line
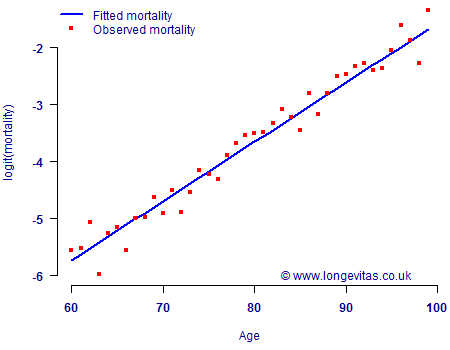
Regular readers of this blog will be in no doubt of the advantages of survival models over models for the annual mortality rate, qx. However, what if an analyst wants to stick to the historical actuarial tradition of modelling annualised mortality rates? Figure 1 shows a GLM for qx fitted to some mortality data for a large UK pension scheme.
Figure 1. Observed mortality rates (•) and fitted values (—) using a binomial GLM with default canonical link (logit scale). Source: Own calculations using the mortality experience of a large UK pension scheme for the single calendar year 2009.

Figure 1 shows that the GLM provides a good approximation of the mortality patterns. A check of the deviance residuals (not shown) yields no areas of concern and both the goodness-of-fit and runs tests are passed. Figure 1 was based on a binomial model for grouped mortality counts, but a GLM for a single year's data also extends neatly to a Bernoulli model at the level of the individual.
So far, so good. We have a model which fits rather well to the mortality experience spanning a single year, and we can construct it at the level of the individual. A natural thing to want to do is to make more use of the available data, say by using mortality-experience data spanning several years instead of just one. This has numerous benefits, not least the ability to smooth out annual fluctuations. The most sensible thing to do would be to switch to a survival model so that we explicitly modelled the survival probability, tpx. However, what if the analyst really wants to stick to historical actuarial tradition of modelling annualised mortality rates? What options are available for using mortality experience at the level of the individual, but spanning more than a single year?
We have previously discussed two ways of getting this wrong in a GLM for qx for individual lives:
- Including each life multiple times, thus violating the independence assumption.
- Attempting to use fractional years of exposure by weighting instead of changing the mortality rate.
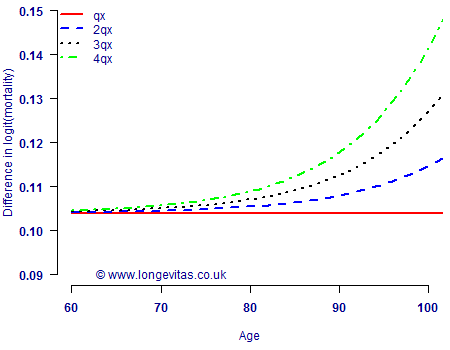
One solution might be to model the t-year probability of death, tqx, instead of the one-year probability. Unlike item (1) above, this would certainly preserve the validity of the independence assumption — there would only be one data point per person, as required. Of course, one obvious drawback of modelling tqx would be the loss of information inherent in qx models, which clearly gets worse as t increases. However, there is another problem in that the t-year probability of death, tqx, will not be linear on the same scale as qx if the latter is linear. This is obviously a major problem for a GLM, where the assumption of linearity is central. An illustration of this is shown in Figure 2 using the fitted mortality rates from Figure 1.
Figure 2. Differenced logit of t-year mortality rate. A horizontal line indicates a linear pattern on a logit scale, while any other shape indicates a non-linear pattern.

Figure 2 shows that if qx is linear on a logit scale, then tqx cannot be for t>1, with the problem getting worse for larger values of t. However, Figure 1 shows that qx is indeed very well approximated as linear on a logit scale. This means that modelling tqx cannot be easily done using GLMs without sacrificing much of the simplicity of the model in Figure 1. Furthermore, the actuary still has to work out a method of backing out annual mortality rates from the t-year modelled rates. This typically involves some additional steps involving fiddly approximations.
One way around this might be to include age as a factor instead of a covariate. However, this would increase the number of parameters a lot, especially if the model included age interactions (as most need to do). Another option might be to include a polynomial of age as a means of allowing for the non-linearity demonstrated in Figure 2. In practice this does not work nearly as well as one might hope. For large data sets, age-based splines will likely be necessary to capture the shape of tqx. Also, Figure 1 shows that the polynomials would only be necessary because of the failure of the model specification in the first place.
In short, trying to model tqx as a GLM causes a fair number of problems, and these problems themselves require further — and imperfect — remedial solutions. It is for these reasons that we regard survival models as the most sensible way to model risk at the level of the individual.


Add new comment