Mortality forecasting in a post-COVID world
Last week I presented at the Longevity 18 conference. My topic was on robustifying stochastic mortality models when the calibrating data contain outliers, such as caused by the COVID-19 pandemic. A copy of the presentation can be downloaded here, which is based on a paper to be presented at an IFoA sessional meeting in November 2024.
One question from the audience was how quickly robustified stochastic mortality models incorporate any new trajectory. There are sound reasons to expect post-covid mortality to be different from pre-covid mortality:
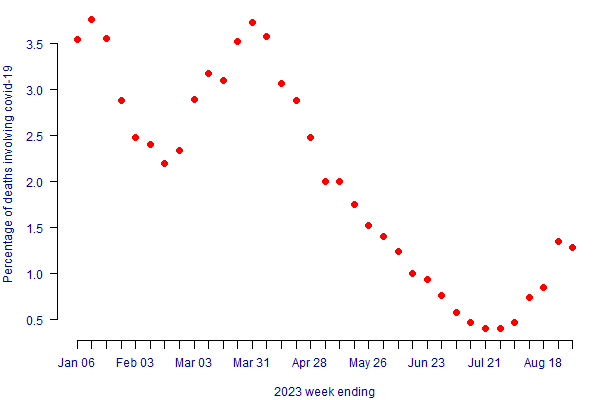
We have a new endemic cause of death. Although the pandemic has been declared over, COVID-19 is still circulating and is still killing people. Figure 1 shows the extent to which COVID-19 is a cause of death in England & Wales in 2023.
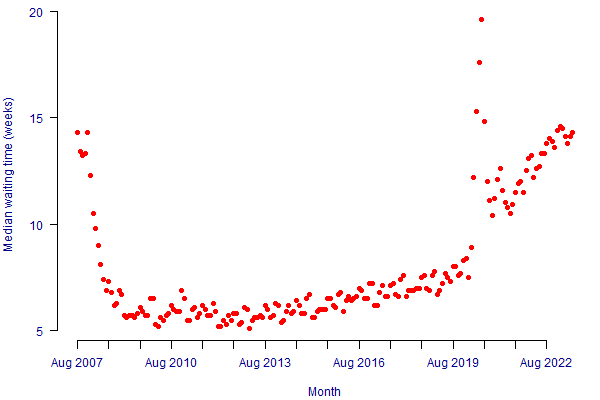
Diagnosis delays and treatment backlogs. Many medical appointments were delayed during lockdowns, including cancer screening. In the UK this has led to much-increased waiting times for healthcare services, as shown in Figure 2.
Elevated post-recovery mortality. Those who have recovered from an infection often have sequelae, a generic medical term for further downstream consequences. In the case of COVID-19, many recovered patients have tiny blood clots for months afterward; see Figure 3.
Figure 1. Proportion of deaths in England & Wales due to COVID-19 in 2023. Source: ONS data, accessed on 15th September 2023.

Figure 2. Median Referral to Treat Times (RTT) for NHS hospitals in England. Source: NHS England, accessed on 15th September 2023.

Figure 3. A - repeat platelet-poor plasma (PPP) sample from healthy volunteer before COVID-19; B - same volunteer now with long COVID. Source: Pretorius et al (2021).

So, there are good reasons to expect that the post-pandemic trajectory of mortality improvements in the UK will be different from the pre-pandemic trajectory. How quickly will robustified stochastic projections reflect this? The answer depends how quickly a model generally changes forecast direction. This is related to the model's fundamental structure and also its parameter stability. You can get an idea of the responsiveness of a model to new data by running a value-at-risk (VaR) simulation; see Richards et al (2014, Section 10). In general, models that produce higher VaR capital requirements are more sensitive to new data, and will thus more quickly respond to any new direction taken by mortality levels.
References:
Pretorius, E., Vlok, M., Ventner, C., Bezuidenhout, J. A., Laubscher, G. J., Steenkamp, J. and Kell D. B. (2021) Persistent clotting protein pathology in Long COVID/Post-Acute Sequelae of COVID-19 (PASC) is accompanied by increased levels of antiplasmin. Cardiovascular Diabetology, 20(172), 2021. doi: 10.1186/s12933-021-01359-7.
Richards, S. J., Currie, I. D. and Ritchie, G. P. (2014) A value-at-risk framework for longevity trend risk. British Actuarial Journal, 19(1), pages 116-167, doi: 10.1017/S1357321712000451; preprint.
Robustification and VaR in the Projections Toolkit
Most models in the Projections Toolkit have options for robustification. See the blogs and documentation for univariate models, multivariate models and the 2DAP model.
All models in the Projections Toolkit are capable of running value-at-risk (VaR) assessments.


Add new comment