The cohort effects that never were
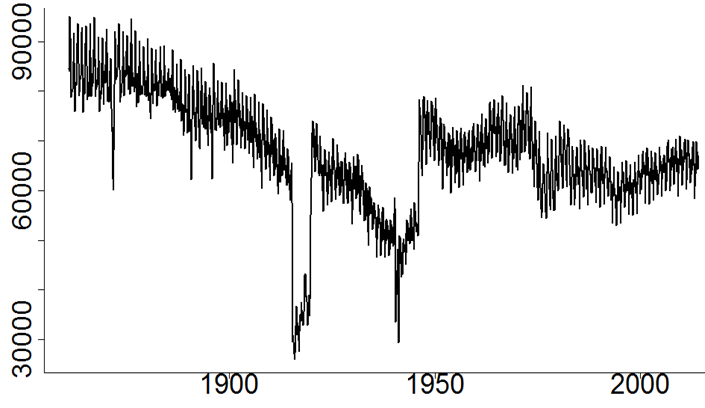
The analysis of cohort effects has long fascinated the actuarial community; these effects correspond to the observation that specific generations can have longevity characteristics different from those of the previous and the following ones. However, Richards (2008) conjectured that these cohort effects might be errors caused by sudden changes in fertility patterns. Figure 1 shows the specific example of France, although the phenomenon is universal. The most significant fluctuations can be seen when birth rates fall dramatically during periods of war, such as World War I, and then spike afterwards.
Figure 1. Monthly births in France. Source: Human Fertility Database.

To understand the impact of these fluctuations in births, we must consider the quite different natures of the numerator and the denominator in population mortality rates: for a given year and age, the mortality rate is the ratio of the number of deaths and the so-called exposure-to-risk. The number of deaths at a given age is captured using death certificates, but the exposure-to-risk requires a detailed assessment of the total exposure period during which individuals live a given year with a given age. In the absence of continuous observation of the population, the exposure-to-risk is approximated using annual records extracted from the census. The standard (but erroneous) assumption underlying the calculation is the uniform distribution of births, leading to an approximation of the exposure-to-risk by age as the average between the populations by age at the beginning and at the end of the year. However, Figure 1 shows that this linear approximation is inexact, and can lead to false cohort effects.
Following Cairns et al. (2016), Boumezoued (2016) highlighted the universal nature of these false cohort effects, which were present in most period tables in the Version 5 of the Human Mortality Database (HMD). The HMD has worked on its own approach to this problem and released a Version 6 update in February 2018, including a revision of exposure calculation based on monthly birth counts when available. Further mathematical developments have been proposed by Boumezoued et al (2018, 2019), who provide improved estimators and a related theory for death-rate inference. The impact of the correction is shown in Figure 2, which shows the removal of false cohort effects that were previously present in the data.
Figure 2. Monthly improvements in France using uncorrected HMD data (left panel) and after correcting for birth distribution (right panel). Source: own calculations.

The correction of national mortality rates, especially for the generations born in periods with high fertility volatility, has implications for actuarial risk assessments. Eliminating false cohort effects changes the level of mortality rates, upward or downward, for the generations considered. If actuaries use general population mortality rates, say for setting mortality-improvement assumptions, then these will be affected. For France, the magnitude of these changes is particularly high; the order of relative change can reach up to 6%. But France is not the only country with high-order errors; we see them in the data of England & Wales, Italy, Germany, and the United States, among others. As false cohort effects are eliminated, actuaries need to revisit the models they use to produce forecasts, especially those with a cohort component. Only true cohort effects can be allowed to remain.
There are other consequences beyond changes in mortality level — the corrected historical volatility of mortality-improvement rates over the last 30 years shows a significant reduction from those based on uncorrected mortality tables, especially at ages over 60. Observed volatility is reduced when artificially high and low levels of mortality are corrected. This will change the calibration of stochastic mortality models, such as those used for value-at-risk assessments under Solvency II.
The revised HMD data is a welcome step forward, but there are consequences for the life-insurance sector and related securitization markets. Actuaries need to use this corrected data and revisit their calculations for mortality and longevity risk.
References:
Boumezoued, A. 2016. Improving HMD mortality estimates with HFD fertility data, North American Actuarial Journal (to appear).
Boumezoued, A., Hoffmann, M. and Jeunesse P. 2018. A new inference strategy for general population mortality tables. https://hal.archives-ouvertes.fr/hal-01773665.
Boumezoued, A., Hoffmann, M. and Jeunesse, P. 2019. Non-parametric adaptive inference of birth and death models in a large population limit. http://arxiv.org/abs/1903.00673.
Cairns, A. J. G., Blake, D., Dowd, K. and Kessler, A. R.. 2016. Phantoms Never Die: Living with Unreliable Population Data, Journal of the Royal Statistical Society, Series A, 179(4): 975–1005.
Richards, S. J. 2008. Detecting year-of-birth mortality patterns with limited data, Journal of the Royal Statistical Society: Series A, 171(1): 279–298.
Previous posts
Mortality down under
Is your mortality model frail enough?
Mortality at post-retirement ages has three apparent stages:
A broadly Gompertzian pattern up to age 90 (say), i.e. the mortality hazard is essentially linear on a logarithmic scale.
The rate of increase in mortality slows down, the so-called "late-life mortality deceleration".


Add new comment