New year, new insights
Happy New Year to all our readers!
As it happens, 2018 was an unexpectedly interesting year for longevity, especially for those interested in extreme long life and the mortality rates of the "oldest old". Gavin blogged last month about the circumstantial evidence suggesting that the world's longest-lived person, Jeanne Calment, may not have been who she claimed to be. In the same month Saul Justin Newman published two papers on the importance of rare errors in driving apparent mortality patterns at very old ages. In the second of these two papers, Newman (2018b) reminded readers of the case of Carrie White, who for many years was falsely believed to be a supercentenarian (i.e. someone achieving the age of 110 or older):
Carrie White successfully claimed to be the world’s oldest and then second-oldest person. Documents certifying her age endured global scrutiny for 24 years. Her record was verified and accepted by the Gerontology Research Group and the Guinness World Records Book.
The Carrie White record was retracted in 2012 after it was shown to be the result of a clerical error that inflated her apparent age from 102 to 116. A single age-coding error by a mental institution worker was copied to all later documents and validated. Absent the survival of this otherwise obscure document, the Carrie White record would stand as a document-validated supercentenarian.
So, on the one hand we have apparent extreme old age from a possible fraud (Calment), while on the other we have apparent extreme old age from an innocent clerical error (White). It turns out that there are quite a few false or exaggerated claims to supercentenarian status.
The Carrie White case is of particular relevance to actuaries because it demonstrates the core message of the first paper, Newman (2018a), namely that errors in age or date of birth have an asymmetric impact on mortality analysis. To illustrate this, consider a cohort of lives following the Gompertz mortality law:
\[\mu_x=e^{\alpha+\beta x}\]
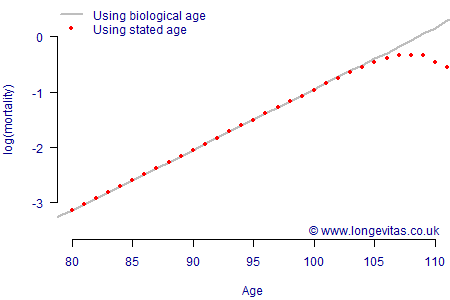
at age \(x\) for given \(\alpha\) and \(\beta\), but where there the stated age contains a low-frequency error. If we pick \(\alpha=-12\) and \(\beta=0.11\), we can consider an age error of ±10 years with frequency 0.005, i.e. an error rate of 5 per 1,000. An error of this magnitude might arise from coding a 1918 year of birth as 1908 (or vice versa), or from switching digits as in using 1921 for 1912 (or vice versa). These errors might be relatively rare, but also hard to detect. As Figure 1 shows, low-frequency errors like this have no discernable impact on mortality at lower ages, which remains Gompertzian, i.e. linear on a logarithmic scale. However, these errors have a marked impact on mortality at ages above 105, where the pattern is decidedly non-linear.

A hallmark of the Gompertz model is a constant rate of increase on a logarithmic scale, as per the grey line in Figure 1. In contrast, the slowing down of increase in mortality by age is given the term "late-life mortality deceleration". Figure 1 shows how such a phenomenon can arise from low-frequency errors.
The Newman hypothesis is very simple, yet it is also both plausible and powerful. Indeed, actuaries analysing the mortality of annuity portfolios and defined-benefit pension schemes will find the shape in Figure 1 very familiar. Is this because the rate of increase in mortality genuinely decreases at advanced ages? Or is it because of a small number of errors in age coding? The R source code behind Figure 1 is available for download on the right, allowing readers to experiment for themselves with different error rates and error sizes.
References:
Newman, S. J. (2018a) Errors as a primary cause of late-life mortality deceleration and plateaus, PLOS Biology, December 2018.
Newman, S. J. (2018b) Plane inclinations: A critique of hypothesis and model choice in Barbi et al, PLOS Biology, December 2018.


Add new comment